sierras tutorial
In this tutorial we will use the sierras module to analyze the diffusion coefficient behavior as a function on temperature with the Arrhenius equation, we will extrapolate its value at room temperature and make a Arrhenius plot. All this in a straightforward way.
First we import the libraries needed
[1]:
import numpy as np
import matplotlib.pyplot as plt
We use the experimental data of diffusion coefficients of lithium in silicon obtained by Fuller and Ditzenberger
[2]:
temperatures = np.array([1250, 1153.36, 1063.13, 970.65, 861.04, 769.34]).reshape(-1, 1)
diffusion_coeffs = np.array([7.72104e-6, 4.386714e-6, 2.23884e-6, 5.58574e-7, 5.15115e-7, 7.58213e-8])
We import the ArrheniusRegressor class from sierras
[3]:
from sierras import ArrheniusRegressor
As can be consulted in the module documentation, this class works in a scikit-learn-like way. Then, we can obtain the activation energy as an attribute of the object, plot agains the experimental data and get the results in a pandas.DataFrame.
We start by creating an arrhenius regressor object from the class with the desired constant value in the exponential of the Arrhenius equation (here the Boltzmann constant, as in the default case)
[4]:
k_boltzmann = 8.617333262e-5
areg = ArrheniusRegressor(constant=k_boltzmann)
fit the data
[5]:
areg.fit(temperatures, diffusion_coeffs)
[5]:
ArrheniusRegressor()In a Jupyter environment, please rerun this cell to show the HTML representation or trust the notebook.
On GitHub, the HTML representation is unable to render, please try loading this page with nbviewer.org.
ArrheniusRegressor()
We can access to the activation energy (in this case k\(_B\) is in eV/K, so this is in eV)
[6]:
areg.activation_energy_
[6]:
0.7617837303407903
extrapolate to room temperature
We could use the predict method to extrapolate to any temperature, but room themperature is really relevant because the time required to obtain this value from a experiment or simulation may be prohibitive. This information is already calculated in extrapolated_process_ attribute.
[7]:
areg.extrapolated_process_
[7]:
1.3856640816386593e-15
This result for the room diffusion coefficient is in the same units as the target data (in this case centimeters squared over seconds).
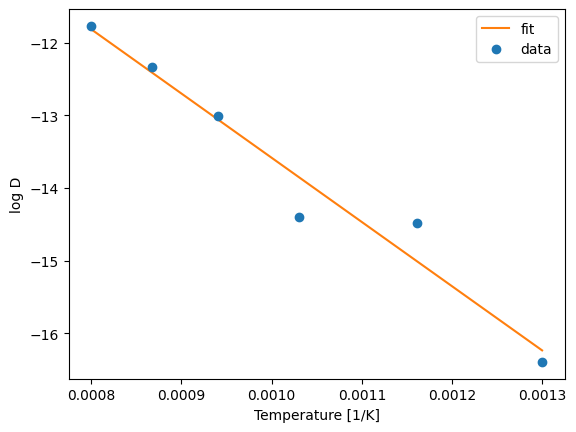
plot
[8]:
fig, ax = plt.subplots()

areg.plot(ax=ax)

ax.set_xlabel("Temperature [1/K]")
ax.set_ylabel("log D")
ax.legend()

plt.show()